Theft is a strong word. It requires two things, desire and a lack of consent. One party desires something from another and takes it without their consent. Simple. My current project is developing an understanding of macroeconomics based on a formal aggregation of microeconomics. I did not anticipate the understanding that I found. This last weekend I worked on understanding claims against wealth inequality. I began by looking at the distribution of income derived form the Average Wage Index (AWI) from 1990-2012. Plotted on a Log-Log scale the distribution appeared to follow a canonical distribution Figure 1.

Figure 1 distribution of wealth (# people/$ v. income) in United States (2012)
Intrigued and following a tip off, I went back and reread a good chunk of Gibbs Elementary Principles in Statistical Mechanics. On page 92-93, I found that after a change of variables from the internal coordinate system of 


Using this density function and assuming that all of wages earned went to action, no savings, and the analogy of wages as expressing individual action, I found that (1) represented the distribution of income quite well for incomes less than $200,000 in 2012, Figure 2. This divergence can be explained in several ways and I have no ability to say quantitatively that one group is disadvantaged over another. A simple explanation is that the savings rate of the higher income individuals is significantly higher than that of lower income individuals. Because my assumption of zero savings is not accurate this is perhaps the simplest explanation. Another narrative would be of class warfare. I do not think this is warranted. I firmly hold that individuals are equal, this means that we each maximize our freedom based on the constraints we are given. If we were to replace individuals form one “class” to another providing each of them with the same path, just with different DNA, that they would respond in the exact same manner as the individual they replaced. Thus if we are to lament income inequality, the real problem is that of the constraints that we provide one group over another. I prefer to look at this as removing barriers to entry and allowing everyone equal opportunity to fail–that no one group should receive any special preference. Success is a reward for prudent risk, failure is the consequence of not succeeding. There must be a symmetry of risk-reward. This is the only approach that maximizes the entropy of the system.

Figure 2 Average Wage Index plot of density of people per income bracket (fit and actual) v. mean income of each bracket.
Armed now with an estimated temperature of 99% of the population, I fit the number of individuals in each income bracket to the density of individuals in the same bracket by integrating (1) over the each bracket. United States macro data shows the results of the regression for each year (


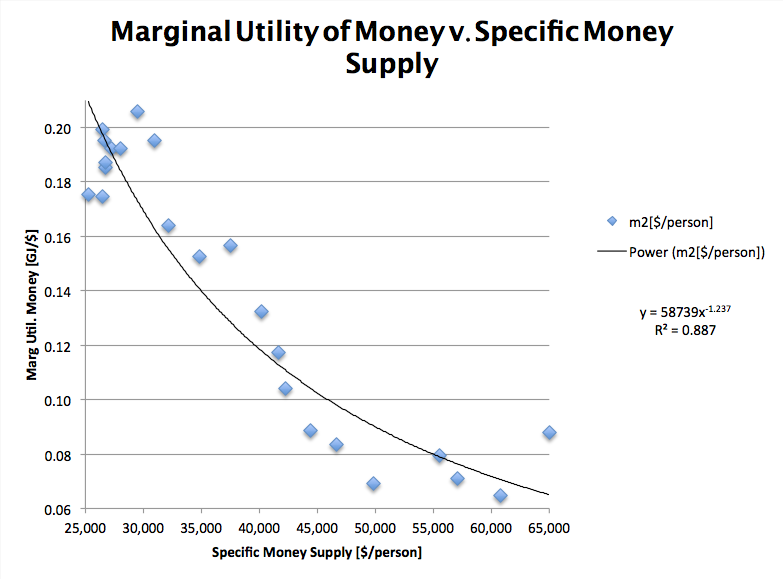
Figure 3. Marginal utility of money v specific money supply 1990-2012
We then use the relationship, 


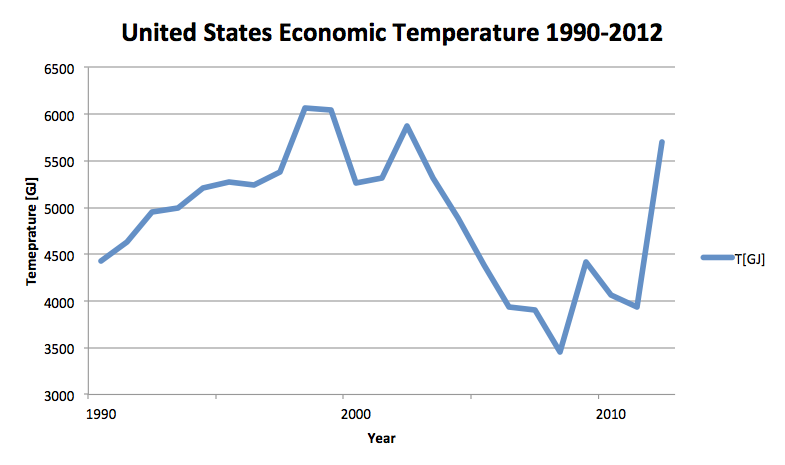
Figure 4. United States economic temperature 1990-2012
These findings yield a powerful relationship, where we can measure the temperature of the economy with the money supply, 

The impact of quantitative easing is chilling and represents the single largest wealth transfer from the poor and middle class. This even manifests in individual freedom,
The loss of freedom is where the real danger is today. We have two separate distributions of individuals within our society, where one is becoming less and less free. This is the cause of revolutions. It is to a large extent brought on by inflation. Our fiscal and monetary policy is destroying our nation and tearing us apart. Since 2000, our money has lost almost 3x its original value. This loss has stabilized since 2008. Here I think, we are seeing the exportation of dollars causing inflation in other parts of the world. Our money supply is restricted because of the export, we are/were the cleanest shirt. Once this changes, and the dollar no longer seen as a safe store of value, we are at risk of serious inflation.
Our leaders, whom we trusted, are either incompetent or are structuring the game to their benefit. I understand where the TEA Party and Occupy get their anger. It is justified. We are being robbed by the men we trusted to govern. Here I harbor no ill against the bankers, while they are facilitating/enabling the theft, they are only responding to the constraints they face. They are protected and not allowed to fail, by our government. The problem is with the systemic constraints and the fundamental constraints on our society are put in place by government. In turn, government is supposed to be constrained by the Constitution. It is our responsibility to enforce governmental restraint.
Fortunately for us we have more choices than just voting at the ballot box. We have whole sets of other spaces where we can choose to act. We do not have to act within the world of fiat currency controlled by unrestrained government. We can act in currency such as bitcoin, gold and silver. Transferring what wealth we have left and our vital action into this new space frees us form an unstable system. It is time to walk away. It is time to have to consciously pay your taxes. Government can no longer passively take your wealth and time if you do this. They are left with pure acts of force and your conscious response to that force. We show the thieves for what they are, thugs. By denying them access to our action we starve them of their sustenance.
I am not provoking a revolution. I do not want one. All I am asking is that you make a decision. Have you had enough?

If I’ve read your figure 4 correctly, a rising temperature would be inferred from greater employment and a lowered money supply. But didn’t we see a greater money supply as well as lower employment (by labor force participation) in 2012?
We did. Also included in the temperature is the price of energy. 2012 saw the lowest natural gas price ever. As a result, use of natural gas skyrocketed (mainly in dual fired coal plants). The focus on energy price (how much energy currency can purchase) is that energy is what drives our capital assets, form computers to cars to machinery. Human and animal physical work is trivial by comparison. Ayers and Warr showed the Solow residual as being entirely due to the economy’s energy use (actually exergy, useful work). 80% of our GDP relies upon the input of useful work into the economy.
When the price of energy falls, the consumption of energy increases and the economy achieves greater action. This is why we saw the spike in temperature. The data point on Figure 3 farthest to the right side of the graph is the most recent data point (2012). There some measurement issues here too. The EIA’s most recent data on total energy consumed and price paid is 2010. I have a model where I take daily oil and natural gas prices and estimate the EPI. It is very a very crude model with a lot of error. There is some artifact of that here.
One way to refine the model is to incorporate actual primary energy use and the efficiency at which we convert it to exergy. I have not had time to build this model, nor have I tried to account for changes in distribution of energy use based on price fluctuations for various fuels.
Here is a link to a post I wrote in March looking at natural gas prices:
If you are interested I can provide the files I use to estimate the EPI, but they are very very very rough.
Pingback: Power for the People: A Cryptographic and Nuclear Renaissance « Statistical Economics
Pingback: Quantifying the Value of Bitcoin « Statistical Economics
Pingback: Fighting povertry – but how? | Undskabens Hotel