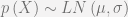
I looked at the distribution of transactions of 1 hour of the block chain (269609 to 269618). I parsed the blockchain into two sets of transactions: originating and receiving addresses. I examined both sets independently and together, attempting to fit the three different trials to Gamma distributions. The receiving addresses proved to have the easiest to interpret set of data, and did not follow a Gamma distribution. Instead, the receiving transactions followed a Log-Normal distribution. Figure 1 shows the results of the data and the resulting fit. The data in figure 1 was parsed into blocks that are 2dB wide (every decade of transactions size is 5 bins, the first bin is 

Figure 1, Receiving address distribution of bitcoin transactions blocks 269609 to 269618 with Log-Normal fit
The Log-Normal distribution is very common especially in biological sciences. It is very simple to estimate using the arithmetic mean and variance.
![\mu=\mathrm{ln}\left[\frac{E\left(X\right)^2}{\sqrt{\mathrm{Var}\left(X\right)}}\right]](https://s0.wp.com/latex.php?latex=%5Cmu%3D%5Cmathrm%7Bln%7D%5Cleft%5B%5Cfrac%7BE%5Cleft%28X%5Cright%29%5E2%7D%7B%5Csqrt%7B%5Cmathrm%7BVar%7D%5Cleft%28X%5Cright%29%7D%7D%5Cright%5D&bg=f4f3f3&fg=666666&s=0&c=20201002)
![\sigma^2=\mathrm{ln}\left[1+\frac{\mathrm{Var}\left(X\right)}{E\left(X\right)^2}\right]](https://s0.wp.com/latex.php?latex=%5Csigma%5E2%3D%5Cmathrm%7Bln%7D%5Cleft%5B1%2B%5Cfrac%7B%5Cmathrm%7BVar%7D%5Cleft%28X%5Cright%29%7D%7BE%5Cleft%28X%5Cright%29%5E2%7D%5Cright%5D&bg=f4f3f3&fg=666666&s=0&c=20201002)
Recall that 

The entropy of the Log-Normal distribution is:

Where

We find that the entropy of the system is an increasing function of 
Differentiating (1), we have

This finding provides a simple method to calculate the action of bitcoin,

and a metric of the number of independent actors within the community,
![\sigma^2=\mathrm{ln}\left[1+\frac{C}{N}\right]](https://s0.wp.com/latex.php?latex=%5Csigma%5E2%3D%5Cmathrm%7Bln%7D%5Cleft%5B1%2B%5Cfrac%7BC%7D%7BN%7D%5Cright%5D&bg=f4f3f3&fg=666666&s=0&c=20201002)
where 
I fit the data in figure 1 by estimating the parameters by:
![\mu=\frac{1}{n}\sum_i^n \mathrm{ln}\left[X_i\right]](https://s0.wp.com/latex.php?latex=%5Cmu%3D%5Cfrac%7B1%7D%7Bn%7D%5Csum_i%5En+%5Cmathrm%7Bln%7D%5Cleft%5BX_i%5Cright%5D&bg=f4f3f3&fg=666666&s=0&c=20201002)
![\sigma^2=\frac{1}{n}\sum_i^n \mathrm{ln}\left[X_i\right]^2-\mu^2](https://s0.wp.com/latex.php?latex=%5Csigma%5E2%3D%5Cfrac%7B1%7D%7Bn%7D%5Csum_i%5En+%5Cmathrm%7Bln%7D%5Cleft%5BX_i%5Cright%5D%5E2-%5Cmu%5E2&bg=f4f3f3&fg=666666&s=0&c=20201002)
This approach seemed to provide the best results. The outcome is highly sensitive to how the parameters are estimated. I am still working on developing this concept, as it has implications in other fields. For example, I tested the income distribution of the US as being Log-Normal. Figure 2 shows the result, the maroon curve is the data and the blue curve is the fitted model.
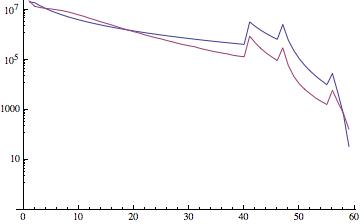
- Figure 2 Plot of the Average Wage Index of the United States (maroon) and the Log-Normal fit (blue) for 2012

There are a number of items that need to be worked out, and as such these findings are still incomplete. The next step is to examine the entirety of the block chain to see how well this model holds up. Additionally, changes in the money supply (number of bitcoins in existence) needs to be accounted in the model. However, without examining the data, such model building is impossible. If anyone has the ability to parse the blockchain any assistance would be appreciated. Thank you.

for the blockchain parsing, there are several tools available. perhaps abe would be best suited for your purposes? https://github.com/bitcoin-abe/bitcoin-abe
Thank you! I will see about compiling it.
Pingback: Progressives Beware: Why what you think you know about economics just ain’t so « Statistical Economics