Cal Abel
23 March 2013
After watching An Inconvenient Truth and becoming aware of the push for renewable energy, I questioned the efficacy of renewable energy sources meeting global energy needs. I thought thermodynamics held the key in being able to understand this. Thus my quest began in January 2007. Today, I can report meaningful progress on this subject.
To build the appropriate model, I started with some publicly available fine grain data from the Bonneville Power Administration. I used data from January 1, 2007 00:00 to February 28, 2011 12:05 PST. The data is segregated into 5 minute blocks of the average power within that 5 minute period. Here is the excel file of the BPA wind power/capacity and grid load. You can verify this data by comparing the previous links. The date format is from Mathematica and is in “Absolute Time” : each full integer is 1 second. As a reference, 3376598400 is January 1, 2007 00:00:00 PST. The data is posted here in a parsed format only for your convenience and to aid in your analysis as the entirety of the modeling can readily be done in Excel if so desired.
The generalization of statistical mechanics to all measurable space done here provided the necessary logical framework and methodology to conduct the technical analysis. When we look at the grid as a market of consumers and the wind being supplied as a market of suppliers we can put the two sources in context with each other under an ideal arbitrage cycle. We can see that wind with an average temperature of 638 MW and the grid at 137 MW is a temperature ratio of 4.66 leading to a significant exergy loss. To minimize losses and the subject of a future post is that when the supply and demand are placed in contact with each other the most efficient outcome occurs when they are in diathermal contact with zero temperature difference. This is directly analogous to exergy analysis of a heat exchanger. The process of communication between the two markets is not ideal and carries with it some non trivial losses. The impact is that in order to make this market function a price premium has to be placed on wind in order to bring it to the market.
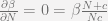
When playing around with the Maxwell relations to find the maximum of 


The next post will calculate the temperatures of a number of various generating assets. I am still working out some technical difficulties in the analysis so this is all very preliminary. As always, I look forward to any feedback on this subject.

Statistical Economics is licensed under a Creative Commons Attribution-ShareAlike 3.0 Unported License.
Based on a work at statisticaleconomics.org.

That a set of many data has a temperature-like property, I can sort of get, but is it wise to call a temperature-like property temperature? Overloading short words makes sense, but long words, not so much.
It has the same mathematical properties as temperature. So in the sense of temperature being a statistical property they are equivalent. Temperature is a measure of the “dither” in the system.
What gets confusing is when we look at traditional thermodynamic systems because entropy has some screwy units J/K. This comes from the Boltzamann which turns entropy into something with dimensional characteristics. If
  is treated as a non dimensional scaling constant, then temperature has units of Joules and entropy becomes a natural non-dimensional measure.
In this work, I let entropy assume natural units, nondimensional, and let . This is why the temperature has the same units as the internal energy/utility of the system.
As you may know, in the energy industry we use entropy as a measure of the irreversibility of a process. Enthalpy and entropy are very important to us when we design energy plant systems. Obviously, they are very complicated systems, so we usually start with a constant entropy situation (which is hypothetical) then we change each item of the energy plant, machine-by-machine, and input the real entropy data. It was done manually till around 30 years ago. Nowadays, trainee engineers can be put in front of a computer screen and taught how to input data for heat exchangers, gearboxes, injectors, de-superheaters – without ever have touched one in a working plant or in the manufacturing shop. That can be the root to many of today’s plant engineering problems.
I am a nuclear engineer by training and back in school after a decade driving submarines. It is interesting to see the lack of physical understanding and the importance of certain design considerations in understanding the design of reactor cores and the impact and limitations of various power conversion cycles.
Trying to have the understanding of the other students I ask about things like net positive suction head and get blank stares. Similarly when discussing how a reactor starts up newly minted masters and PhD’s look at me perplexed by the question.
What drove me to do this project was seeing policy making assumptions about how the economy evolves that ignores fundamental considerations of access to information. Their analysis was done solely on what you and I consider first law balances, with some fudging of the math. The main problem is that they ignore the consequences of the second law and are surprised when things transpire differently from the intended consequences. To my engineer’s mind, it simply was a product of what Sir Arthur Eddington said about collapsing in humiliation by ignoring the second law. One cannot expect to build a perpetual motion machine.
My focus on quantitative modeling is in energy markets as it relates at least tangentially to my PhD research. Specifically, looking at how energy markets operate in a thermodynamic context. I will post more on this later. Initial work using hourly data shows thermal assets operating at temperatures on the order of 2 for a nuke operating flat out to 120 for a load following coal plant. The grid temperature of the utility I studied was about 250. What this suggests is that these thermal cycles are operating on a Carnot cycle. The second law implication of this is that the temperature of wind turbines is above that of the grid and that capital has to be applied to reduce the uncertainty via the ideal arbitrage cycle elsewhere on this bolg.